Frequently Asked Questions
1. What is the size of the printed array and each ROI “spot”?
2. How is residual standard deviation (res sd) calculated?
3. Which binding-curve analysis models that are available in the Kinetics™ analysis software?
6. What is Rmax and what is its significance?
7. What is the maximum number of analyte cycles with regeneration that can be performed on the LSA?
8. Does the surface regenerate after each cycle?
9. What is meant by floating Rmax?
10. Does the Kinetics software calculate the %Rmax? How consistent are the values among replicates?
1. What is the size of the printed array and each ROI “spot”?
LSA biosensor chips consist of a gold surface mounted on a trapezoidal glass prism, both of which are encased in a plastic cartridge. The printed array is approximately 16 mm wide by 5 mm high. Each printed ROI on the chip surface measures approximately 24 µm wide by 90 µm high.
For more information on chip surfaces: https://carterra-bio.com/lsa/#chip-chemistry
2. How is residual standard deviation (res sd) calculated?
The standard deviation of the residuals reports the overall agreement of the fitting model vs. the observed data. It is calculated using the sum of squared differences between each observed data point (Rx) and the model value (Rm) divided by the total number of points. Res sd is reported in RU.

3. Which binding-curve analysis models that are available in the Kinetics™ analysis software?
Models available in Kinetics include:
- kd = Off-rate only model
- kdka = 1:1 Langmuir binding model
- kdkakm = Mass transport model
Use of more complex models to describe interactions beyond a simple 1:1 model requires a detailed knowledge of binding mechanisms. Instead, assay optimization is recommended to achieve 1:1 binding for example through use of monovalent analytes and minimal ligand densities.
In instances where advanced models are absolutely required, data can be exported for analysis into third party software.
4. Does re-sampling of ligand from the same well-plate during multiple surface arrays affect the data quality?
Stability of the ligand needs to be considered when developing an SPR assay and assuming the ligand is stable in its assay buffer, loss of activity across multiple prints should be minimal.
- Potential for dilution of sample when printing multiple times: The multi-channel side of the LSA requires a minimum of 200 ul of sample to be in each well of a 96 or 384 well plate. After each print, a small amount of sample (~20 ul) gets sent to waste to prevent any dilution from the running buffer when samples are being returned to the plate.
- Consider adding 25 ul extra volume (a little extra to account for error) for each re-sampling event. For example, if you are going to print from the same plate 4x, prepare a plate with 300 ul per well.
- Potential for ligand depletion from solution when printing multiple times: The surface area of the spotted region is very small, approximately 400 µm2 and most of the solution is not in contact with the surface during printing making significant depletion of ligand unlikely.
- A scenario where this might be a noticeable is if a capture spot has a very high ligand density and a low concentration sample with a high affinity was captured for an extended period.
5. What is the sensitivity of the LSA for smaller MW analytes? Is there a minimum MW cutoff for analytes?
Sensitivity limitations for lower MW analytes will depend on the interaction being measured. SPR is a mass-based detection technology and the analyte binding signal is proportional to the stoichiometry of the interaction and can be theoretically calculated. As a general rule, in order to maintain a specific RU signal, ligand density will need be increased as analyte MW decreases, with attention paid to the binding stoichiometry of the ligand and analyte.
Here is an example of a lower MW analyte binding to captured antibodies:
- Ligand: Panel of mouse mAbs (MW 150 kDa) captured as an array on an anti-mouse surface
- Analyte: 7 amino acid peptide (MW 1 kDa)
- Using the Rmax equation, to achieve a 40 RU Rmax signal of analyte binding to a 150 kDa ligand with a valency of 2, the total RU of mAb captured is 3000 RU:
40 RU Rmax = 3000 RU x (1 kDa / 150 kDa ) x 2
6. What is Rmax and what is its significance?
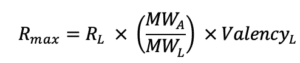
Rmax represents the maximal feasible SPR signal generated by an interaction between a ligand – analyte pair and is represented in response units (RU). In the Rmax equation below, RL corresponds to the RU level of ligand on the surface. MWA and MWL are the analyte and ligand molecular weights, respectively, and ValencyL is the valency or number of discrete analyte binding sites on the ligand.
Rmax is most commonly fitted globally for a single ligand-analyte pair. If an analyte species is injected at different concentrations over same ligand surface, then the theoretical Rmax will be the same for every injection. However, if for example the binding sites decrease due to surface regeneration, then the Rmax may vary from one analyte injection to another.
Having observed Rmax greater than its theoretical value can be indicative of insufficient curvature during the association phase. An Rmax below the expected theoretical max could indicate loss of ligand activity.
7. What is the maximum number of analyte cycles with regeneration that can be performed on the LSA?
Deck capacity of the LSA single channel needle sampler enables approximately 400 cycles of analytes in a single experiment, each of which can contain a regeneration pulse. The ability of the immobilized ligand to tolerate a given regeneration condition will dictate the number of cycles with regeneration that still allow for adequate analyte binding. Additionally, the acceptable loss of ligand activity due to regeneration will be somewhat dependent on assay objectives. Therefore, the maximum number of regenerations will be ligand and assay specific.
For a kinetics experiment, a non-regenerative approach is a good option to ensure there is minimal loss of ligand activity throughout an experiment and avoids the need to identify optimal regeneration conditions. An additional benefit is that this assay format uses minimal quantities of ligands. For kinetic experiments, most capture surfaces (anti-Fc, Protein A/G) are unaffected by the typical cycle numbers required if regeneration is chosen.
In epitope binning, where hundreds of regeneration events are required, regeneration scouting prior to the experiment is highly recommended. It is difficult to select a regeneration strategy that is optimal for an entire array of antibodies, however selecting the least harsh regeneration condition that thoroughly regenerates the majority of the panel is the most practical approach. Even if some ligands lose activity during the experiment, both the antigen signal normalization feature in Epitope™ and the bidirectionally competitive design of epitope binning can still facilitate meaningful data interpretation.
8. Does the surface regenerate after each cycle?
Regeneration after each cycle will be determined by the Experiment Wizard app chosen and the options within. For surface preparation wizards, typically there is no option to regenerate the surface. In Navigator version 1.7.4, a regeneration injection is included at the end of every cycle or set. In Navigator 2.1 and beyond regeneration is optional and can be chosen along with the number of regenerations in each cycle and the location of those regeneration solutions.
9. What is meant by floating Rmax?
Floating Rmax is an option in the Kinetics™ analysis software allowing the binding curves in a kinetic titration to be fit independent of one another with regard to Rmax. Floating Rmax should be used only in specific circumstances. Here are 2 scenarios where it is appropriate to use the floating Rmax option:
- Performing a multi-cycle kinetics experiment with regeneration and the chip surface is losing activity from cycle-to-cycle
- Performing a multi-cycle capture kinetics experiment with regeneration and the ligand capture levels vary significantly from cycle to cycle.
Since Rmax is changing across the assay in these 2 scenarios, differences between the data and the fitting model are increased when applying a global Rmax value and therefore local Rmax fitting is more appropriate.
10. Does the Kinetics software calculate the %Rmax? How consistent are the values among replicates?
The Kinetics software does enable calculation of %Rmax during analysis, by use of the Specific Activity feature on the Kinetics tab. To determine specific activity, the user enters the MW and valency of the ligands and analytes, then using the Immobilization tab determines the amount of ligand immobilized. In conjunction with these values, experimental Rmax is then used to calculate specific activity or %Rmax.
In general, Rmax is highly consistent (< 15% variability) across replicates when capturing an array of proteins on a capture lawn surface. Covalent coupling of a protein array can have higher variability in Rmax due to the random nature of this immobilization approach. For both types of array surfaces, lower concentrations tend to have less variability. Including ligand replicates is a powerful option on the LSA, and very few SPR technologies can offer this capability in a single experiment, which allows for additional confidence in %Rmax calculations.