Frequently Asked Questions: From SPR Binding Assay to LSA Platform
1. What is High Throughput Surface Plasmon Resonance (HT-SPR)?
3. What is Rmax and what is its significance?
4. What is meant by floating Rmax?
6. How is residual standard deviation (res sd) calculated?
For our current customers, please login to the Customer Support Portal to view a more comprehensive list of FAQs.
1. What is High Throughput Surface Plasmon Resonance (HT-SPR)?

The Carterra LSA utilizes gold standard Surface Plasmon Resonance to detect binding interactions in real-time for up to 384 samples in parallel. While traditional SPR biosensors have practical limitations in the number of unique measurable locations per surface area, imaging-based SPR can monitor hundreds of locations within a tightly constructed array, while still maintaining excellent sensitivity and data collection rates.
The LSA utilizes a laser diode light source to illuminate the functionalized gold surface at the interface with the prism and reflected light is detected via a high-resolution CCD camera. At the boundary of the functionalized gold layer and the glass prism a certain fraction of incident light photons propagates as surface plasmons, forming an evanescent field which is sensitive to changes in refractive index (RI) at the functionalized surface. When the RI changes, such as when molecules bind, the angle of incident photon absorption shifts and this change in the minima of reflected light is used to quantify binding.
While the CCD camera in the LSA can monitor the entire area, data collection is focused on locations by using flow printing technology (up to 384), as well as unprinted locations typically used as references (48), totaling 432 spots, over which a single analyte is then flowed.
Benefits include 100x more data, in 10% of the time to answer and requirement of 1% sample requirements of other platforms while delivering greater throughput and assay sensitivity.
2. Does re-sampling of ligand from the same well-plate during multiple surface arrays affect the data quality?
Stability of the ligand needs to be considered when developing an SPR assay and assuming the ligand is stable in its assay buffer, loss of activity across multiple prints should be minimal.
- Potential for dilution of sample when printing multiple times: The multi-channel side of the LSA requires a minimum of 200 ul of sample to be in each well of a 96 or 384 well plate. After each print, a small amount of sample (~20 ul) gets sent to waste to prevent any dilution from the running buffer when samples are being returned to the plate.
- Consider adding 25 ul extra volume (a little extra to account for error) for each re-sampling event. For example, if you are going to print from the same plate 4x, prepare a plate with 275 ul per well.
- Potential for ligand depletion from solution when printing multiple times: The surface area of the spotted region is very small, approximately 400 µm2 and most of the solution is not in contact with the surface during printing making significant depletion of ligand unlikely.
- A scenario where this might be a noticeable is if a capture spot has a very high ligand density and a low concentration sample with a high affinity was captured for an extended period.
3. What is Rmax and what is its significance?
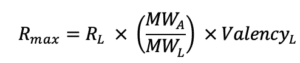
Rmax represents the maximal feasible SPR signal generated by an interaction between a ligand – analyte pair and is represented in response units (RU). In the Rmax equation below, RL corresponds to the RU level of ligand on the surface. MWA and MWL are the analyte and ligand molecular weights, respectively, and ValencyL is the valency or number of discrete analyte binding sites on the ligand.
Rmax is most commonly fitted globally for a single ligand-analyte pair. If an analyte species is injected at different concentrations over same ligand surface, then the theoretical Rmax will be the same for every injection. However, if for example the binding sites decrease due to surface regeneration, then the Rmax may vary from one analyte injection to another.
Having observed Rmax greater than its theoretical value can be indicative of insufficient curvature during the association phase. An Rmax below the expected theoretical max could indicate loss of ligand activity.
4. What is meant by floating Rmax?
Floating the Rmax is an option in the Kinetics™ analysis software allowing the binding curves in a kinetic titration to be fit independent of one another with regard to Rmax. Floating Rmax should be used only in specific circumstances. Here are 2 scenarios where it is appropriate to use the floating Rmax option:
- Performing a multi-cycle kinetics experiment with regeneration and the chip surface is losing activity from cycle-to-cycle.
- Performing a multi-cycle capture kinetics experiment with regeneration and the ligand capture levels vary significantly from cycle to cycle.
Since Rmax is changing across the assay in these 2 scenarios, differences between the data and the fitting model are increased when applying a global Rmax value and therefore local Rmax fitting is more appropriate.
5. What is the sensitivity of the LSA for smaller MW analytes? Is there a minimum MW cutoff for analytes?
Sensitivity limitations for lower MW analytes will depend on the interaction being measured. SPR is a mass-based detection technology and the analyte binding signal is proportional to the stoichiometry of the interaction and can be theoretically calculated. As a general rule, in order to maintain a specific RU signal, ligand density will need be increased as analyte MW decreases, with attention paid to the binding stoichiometry of the ligand and analyte.
Here is an example of a lower MW analyte binding to captured antibodies:
- Ligand: Panel of mouse mAbs (MW 150 kDa) captured as an array on an anti-mouse surface
- Analyte: 7 amino acid peptide (MW 1 kDa)
- Using the Rmax equation, to achieve a 40 RU Rmax signal of analyte binding to a 150 kDa ligand with a valency of 2, the total RU of mAb captured is 3000 RU:
40 RU Rmax = 3000 RU x (1 kDa / 150 kDa ) x 2
6. How is residual standard deviation (res sd) calculated?
The standard deviation of the residuals reports the overall agreement of the fitting model vs. the observed data. It is calculated using the sum of squared differences between each observed data point (Rx) and the model value (Rm) divided by the total number of points. Res sd is reported in RU.