Complete the Form
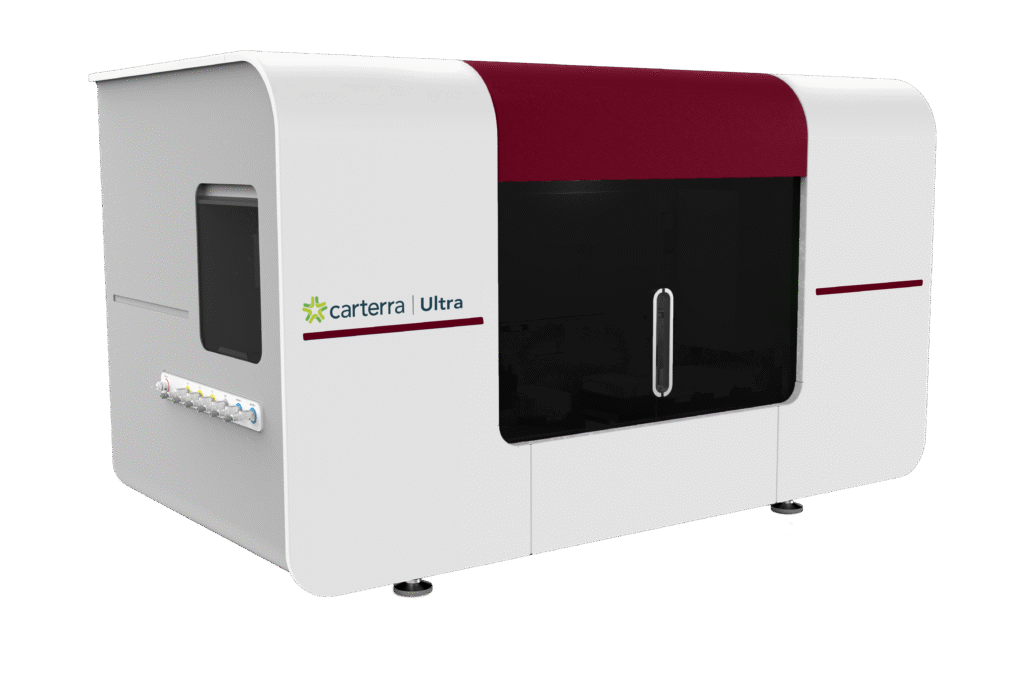
With enhanced sensitivity, expanded thermal options, and advanced microfluidics, the Carterra Ultra platform is our most sensitive instrument for interrogating multiple proteins and off-target binding in parallel.
The new Carterra Ultra is a revolutionary HT-SPR platform that includes enhanced optics, thermal controls, and microfluidics to provide the most advanced high-throughput screening and characterization platform on the market. For the first time, investigators can test fragments and small-molecules as well as large on- and off-targets arrays.
Ultra enables the following automated workflows in a single unattended run:
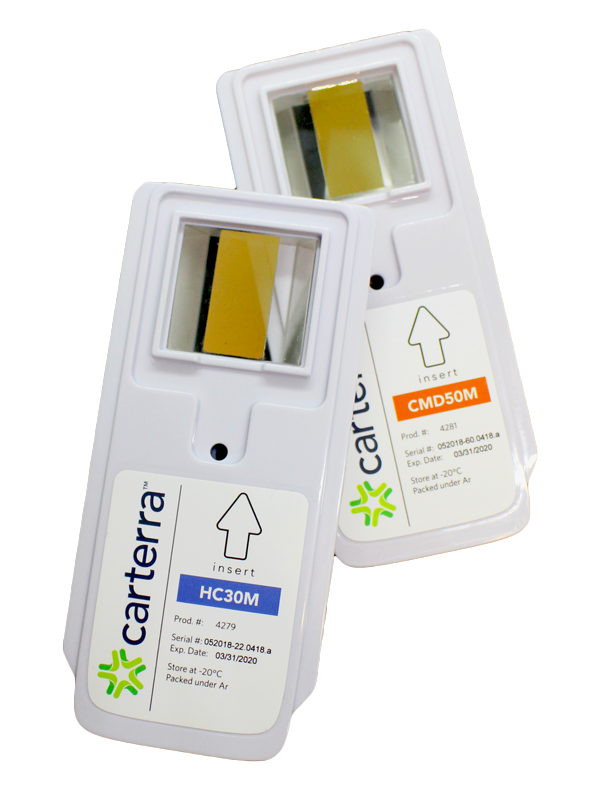
Selection of the appropriate sensor chip surface is essential for robust data quality when designing a high-throughput SPR assay. Carterra offers a broad range of chip surfaces to support the diverse applications available on the Ultra.
With a wide range of sensitivities, Carterra specializes in offering solutions to customers seeking to characterize their drug candidates.
For those working with large molecules, Carterra offers:
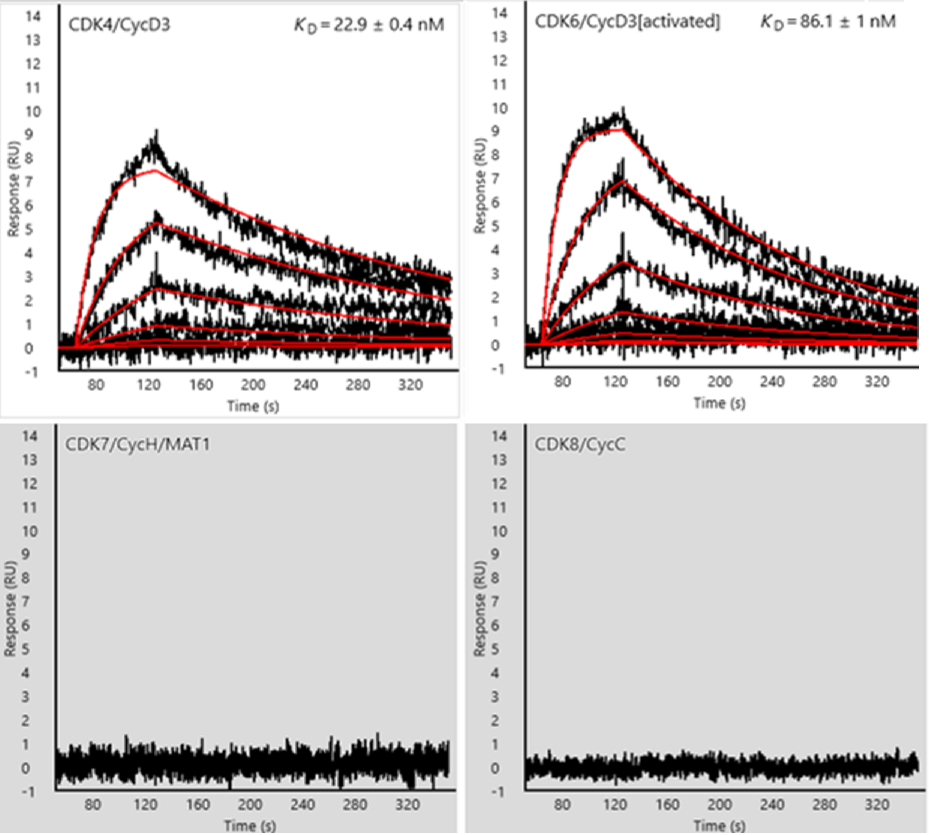
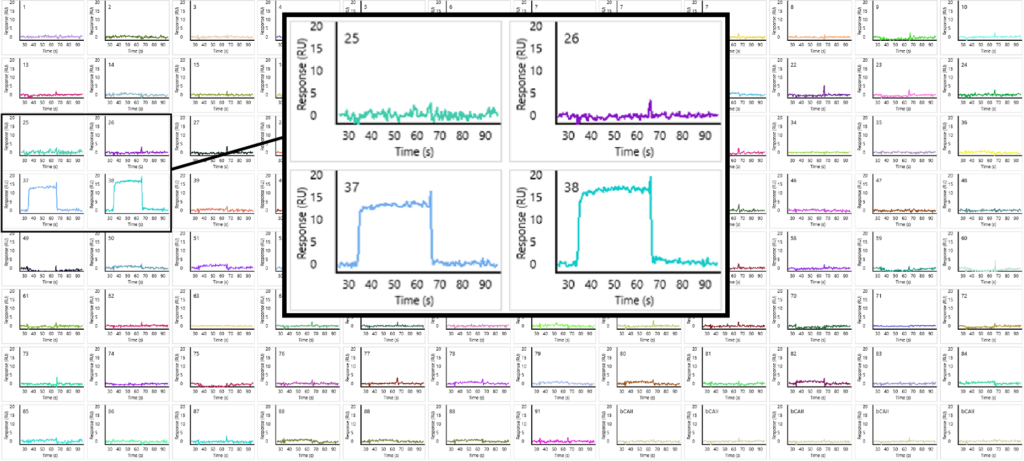
A CDK4/6 dual selective inhibitor shown binding at high affinity to both kinases. No binding is detected to the off-targets of CDK7 or CDK8.
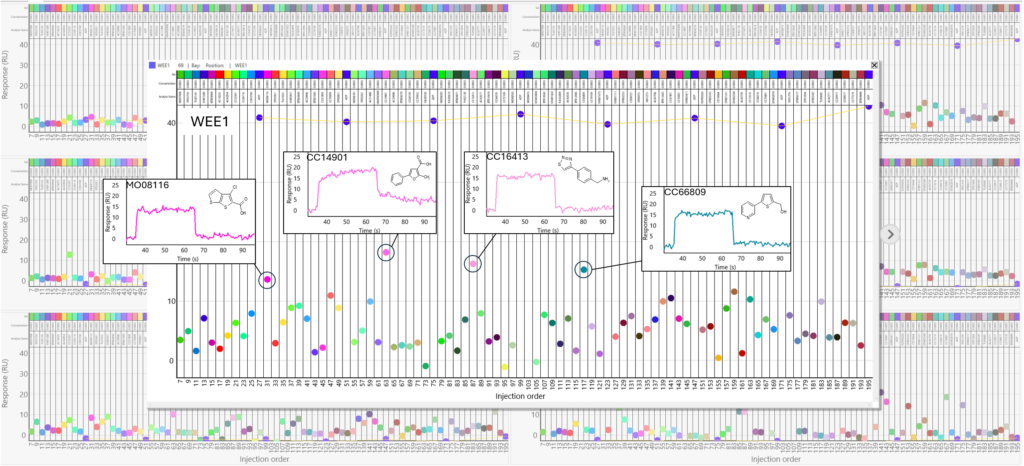
Fragment hit identification against 96 proteins using the Carterra Ultra platform.
Ultra’s throughput, flexibility, and applications are enabled by three core system modules:
1. Patented flow cell technology 2. High throughput SPR 3. Software
The Carterra UltraTM is covered by one or more of the following U.S. Patents: 8,210,119; 8,211,382; 8,383,059; 8,488,120; 8,999,726; 9,682,372; 9,682,396; 10,300,450
Custom Ultra 96-Channel Printhead™:
Cartridge consisting of a 96 array for:
Advanced Single Flow Cell™:
Cartridge covers the entire chip surface for:
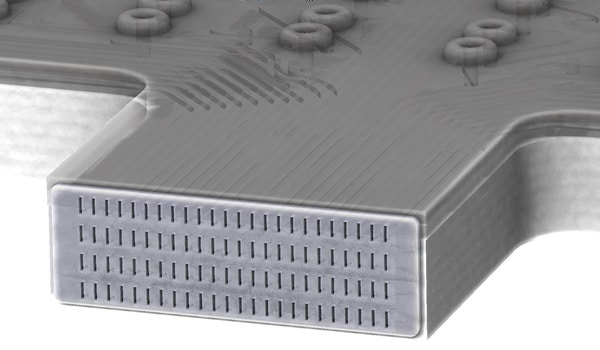
96-channel printhead
The 96-channel printhead enables a 96 protein array to be immobilized in parallel from flow onto a sensor chip surface in a single step. Up to 192 spots available in any combination of active spots and references.
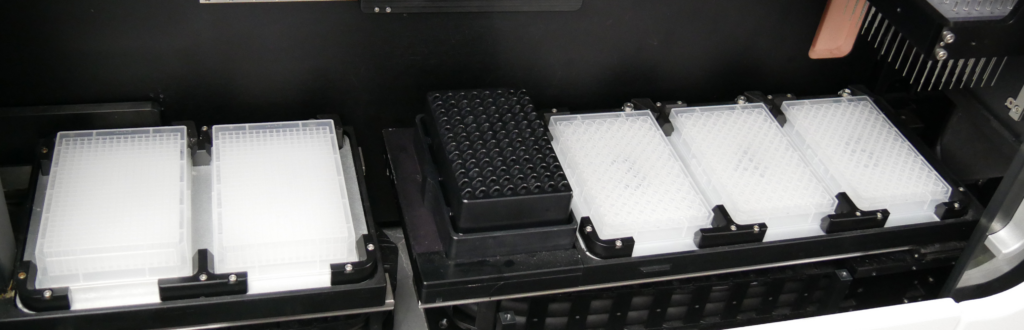
The sample deck adds another layer of throughput and flexibility.
96- or 384-well plates can be used in the Ultra sample deck with 96-channel access in 3 bays and single flow cell access in 2 bays. The sample block has the capacity for 3 x 50ml conical tubes, 5 x 15ml conical tubes, and 8 x 1.5ml tubes.
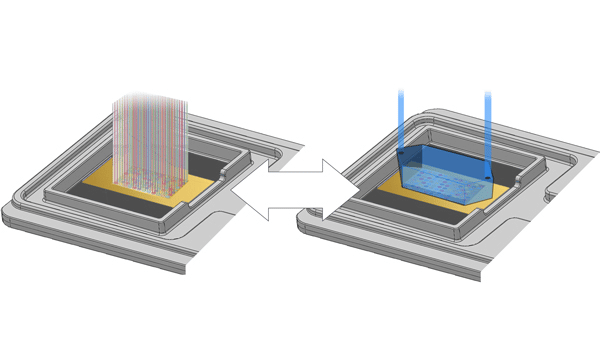
Automated switching between the 96-channel printhead and single flow cell cartridges.
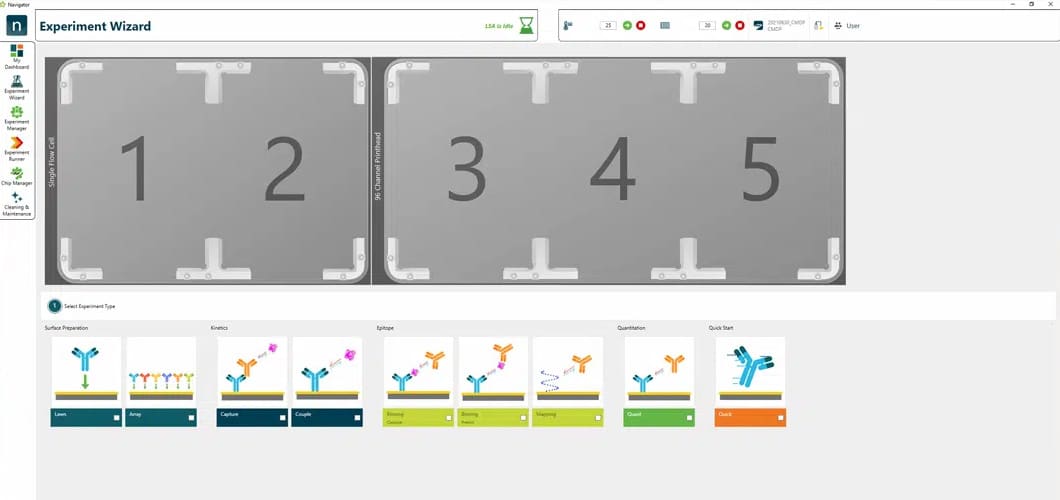
Quickly and efficiently set up experiments using Navigator’s streamlined interface and purpose-built assay wizards. Fully automated experiments allow unparalleled throughput and real-time binding data richness. Queue up to six assays to maximize throughput for up to 7 days of unattended run time.
Key Benefits:
Hands-on time is further reduced via automated data analysis, which enables rapid processing and initial curation of large experiments. Dedicated application-focused analysis software follows intuitive, simple-to-use workflows and powerful visualization tools.
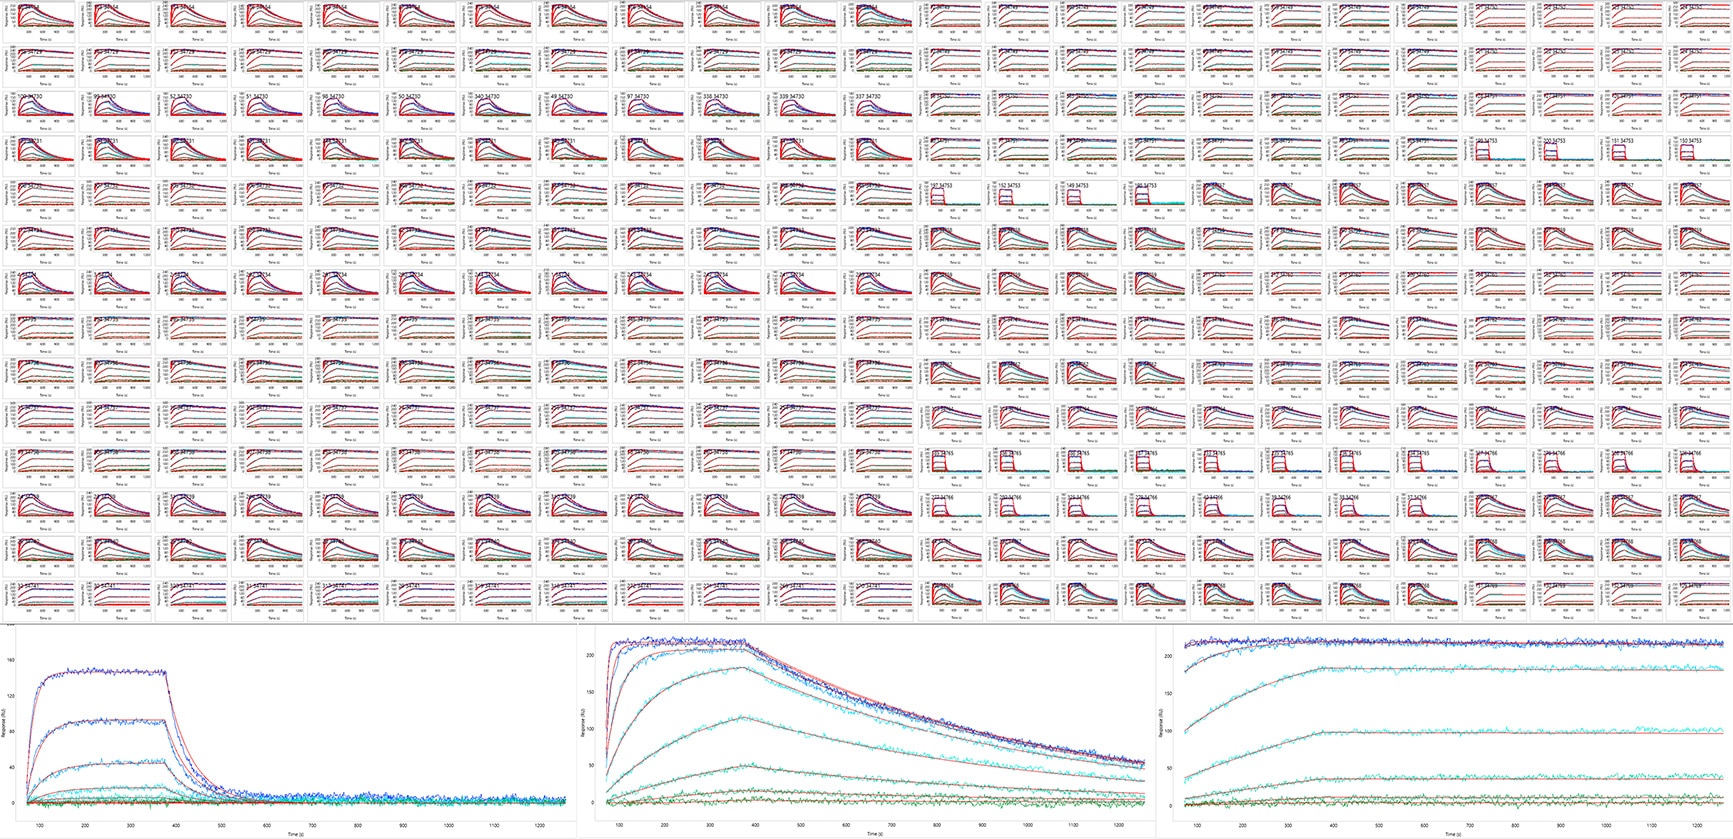
Complete kinetic data processing and analysis can be automated, with referencing, zeroing, cropping, blank subtraction, and kinetic model fitting all executed as a single operation for up to 1152 samples per unattended run.
Learn More about our Kinetics Software
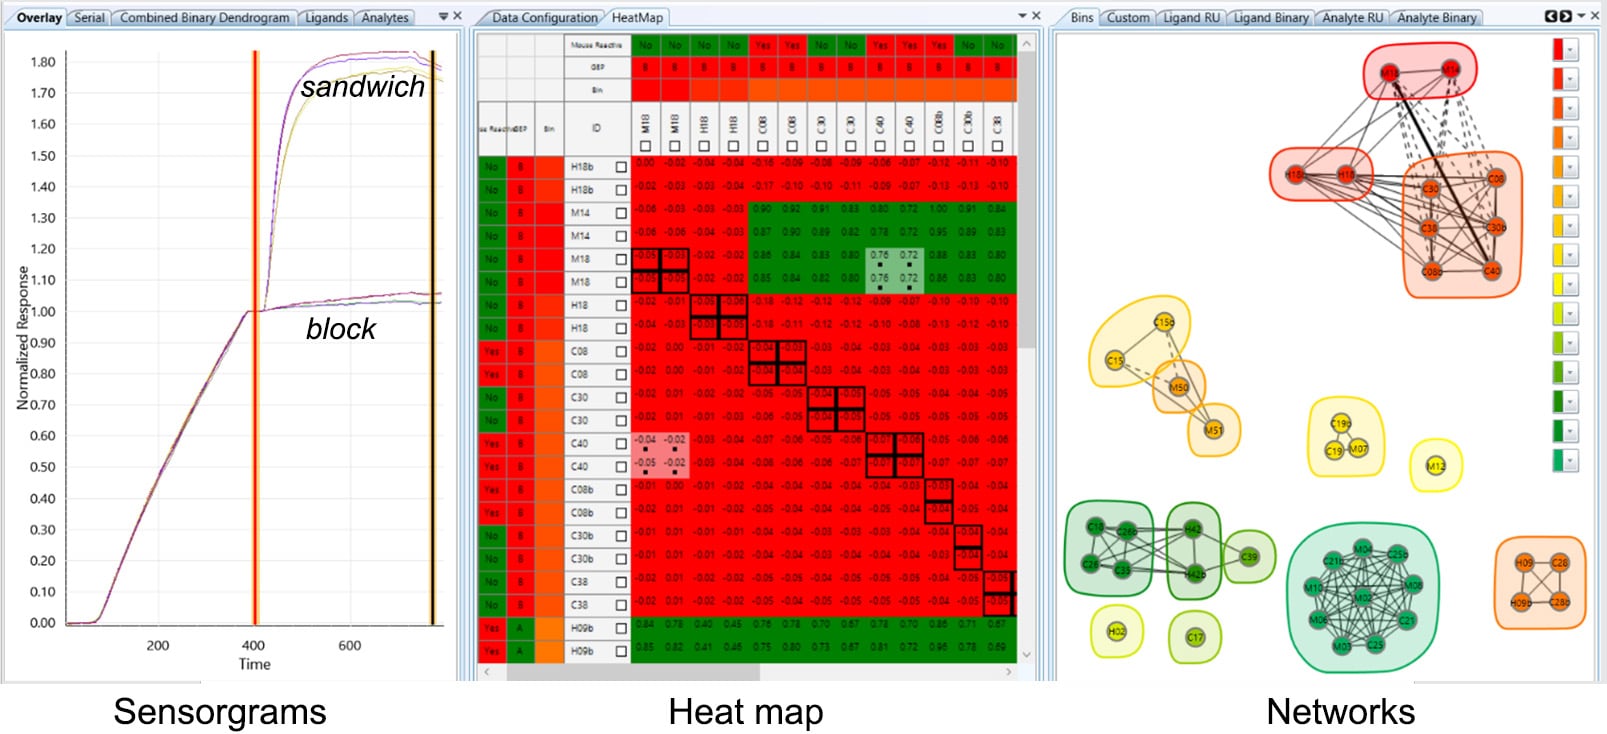
In the binning tool, data are linked across panels to facilitate review of sensorgrams, heat maps, networks, and a dendrogram.
The ability to merge orthogonal data and view networks by color options provide a powerful and intuitive way of assessing your antibody panel’s diversity, while keeping an epitope-centric view.
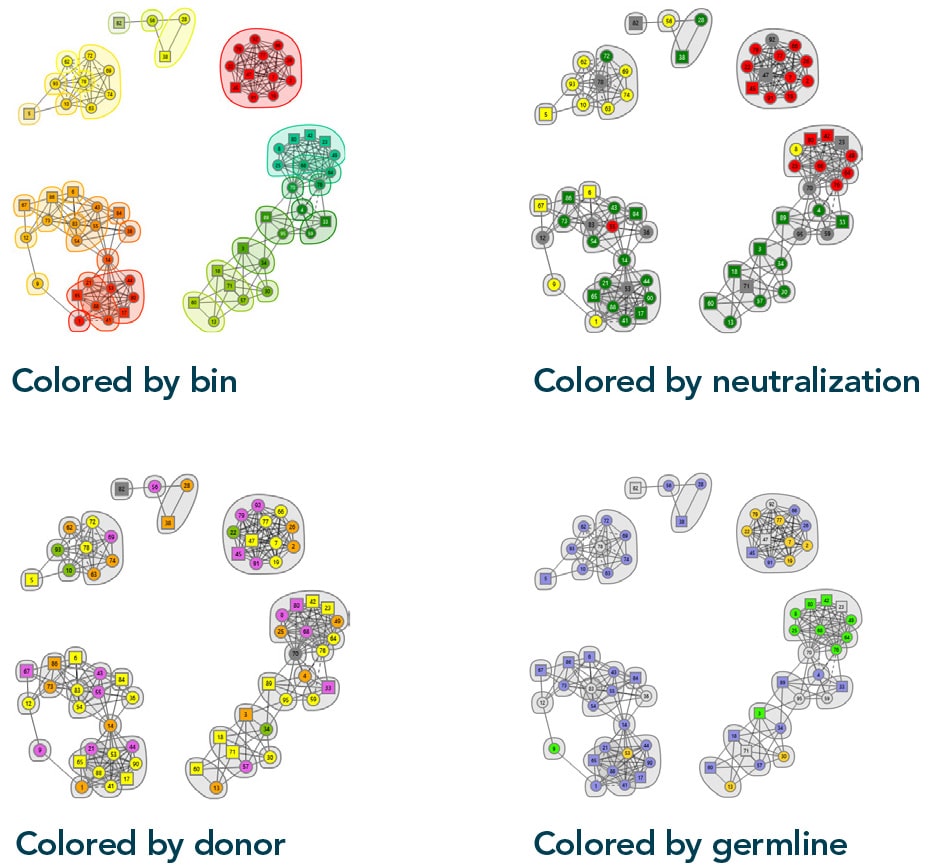
The network plots above provide an alternate view of the data, where chords represent the blocking relationships, envelopes inscribe the bins, and colors depict merged data.
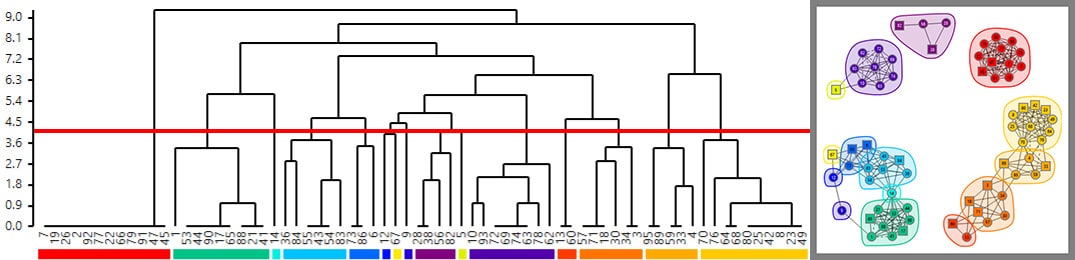
A binning dendrogram, showing an adjustable custom cut-height (red line at 4.1) next to a community plot that is clustered by the custom cut height, which provides a less granular view than the four network plots above where the cut height was zero.